

Warehouse Heat Mapping Tools for Real-Time Warehouse Capacity
Warehouse heat mapping is becoming a critical technology in modern logistics facilities. As warehouses grow more automated and data-driven, operators need better visibility into how space, labor, and equipment are used throughout the day. Heat mapping tools provide that insight by turning real-time operational data into visual maps that highlight congestion, underused zones, and high-traffic areas.
These systems help distribution centers make faster, evidence-based decisions. From identifying loading hotspots to improving layout planning, digital mapping technologies are helping warehouse managers balance efficiency, safety, and capacity utilization.
What Is Warehouse Heat Mapping?
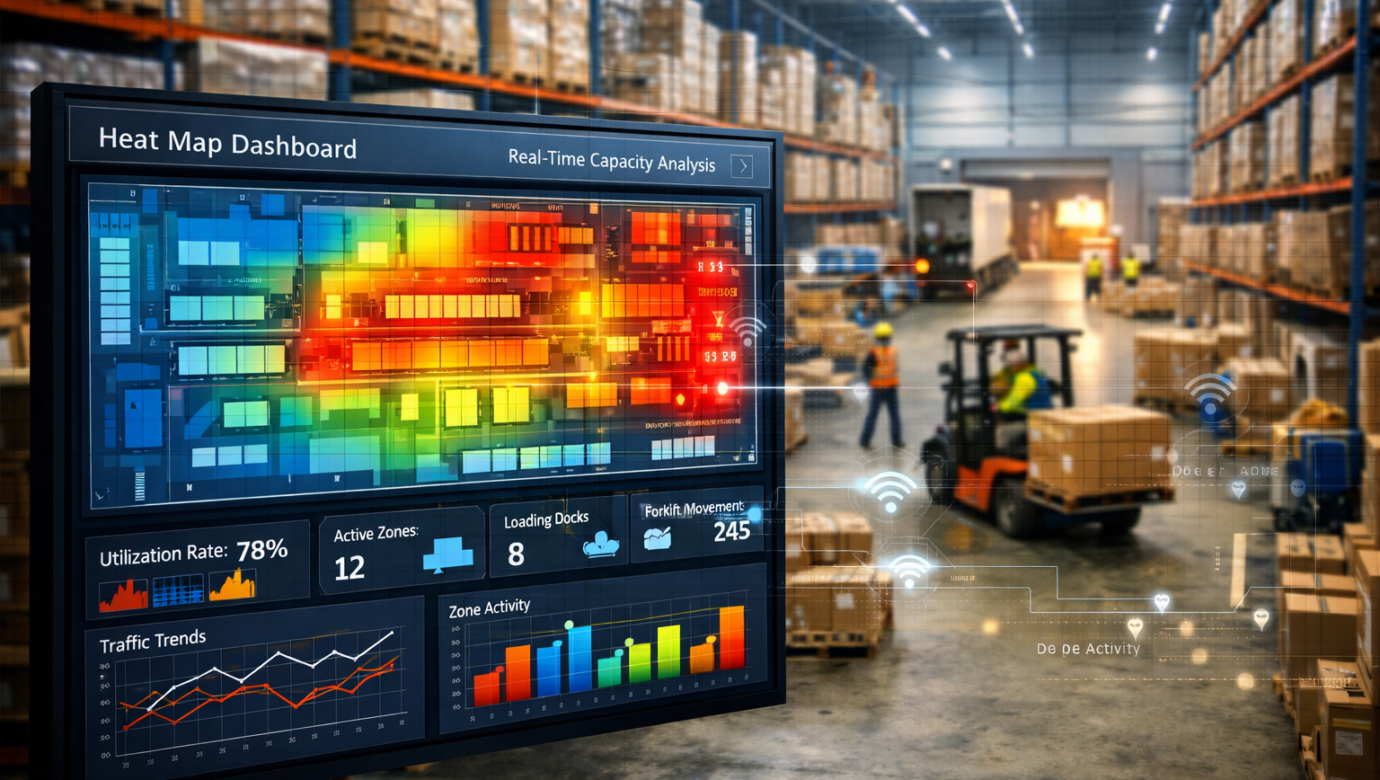
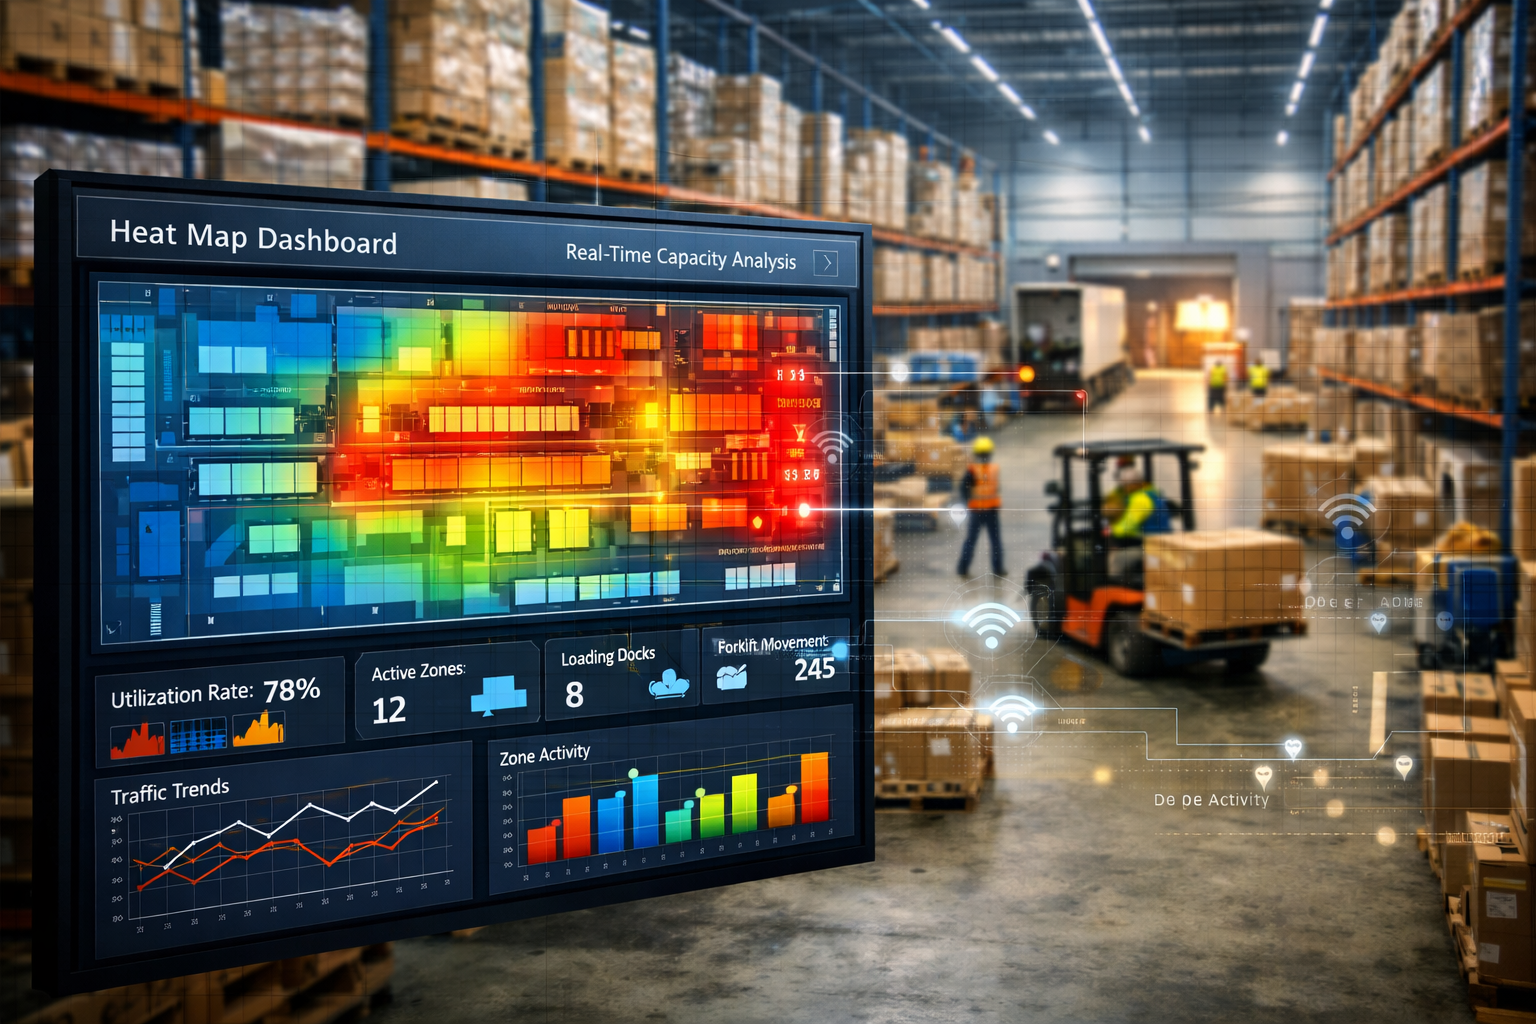
Warehouse heat mapping refers to the use of digital visualization tools that display activity levels across different areas of a warehouse. Colors typically indicate intensity. Warmer shades show high activity or congestion, while cooler tones indicate lighter use.
The data behind these visual maps can come from multiple sources:
- Warehouse Management Systems (WMS)
- IoT sensors and RFID tracking
- Automated guided vehicles (AGVs) and robotics data
- Barcode scans and picking activity
- Dock door usage records
By layering these data streams onto a warehouse layout, operators gain a live or near-real-time view of operational flow.
How Warehouse Heat Mapping Improves Capacity Planning
Identifying Space Utilization Gaps
One of the main uses of warehouse heat mapping is to highlight areas that are either overcrowded or underutilized. Storage zones that consistently show low activity may signal inefficient slotting. Meanwhile, persistent hotspots can indicate bottlenecks that reduce throughput.
Facility managers can use this information to:
- Reassign product locations
- Adjust slotting strategies
- Rebalance inventory distribution
- Expand or reduce certain storage zones
These decisions help maximize cubic space without immediately investing in expansion.
Managing Loading and Dock Congestion
Dock doors often become operational choke points. Heat maps can reveal patterns such as:
- Peak loading times by dock zone
- Imbalanced trailer assignments
- Frequent cross-traffic near staging areas
Armed with this data, supervisors can redistribute inbound and outbound schedules. They can also redesign staging layouts to improve flow and reduce safety risks.
Real-Time Insights for Operational Efficiency
Traditional warehouse reporting often relies on historical data. While useful, it does not always support fast decision-making on the floor. Heat mapping tools close this gap by providing live operational visibility.
Monitoring Labor Movement
Wearable devices, mobile scanners, and task management systems generate movement data. When visualized through heat maps, this data helps managers:
- Spot inefficient travel paths
- Reduce worker congestion
- Improve pick path design
- Balance workload between zones
This leads to better labor productivity and fewer delays during peak shifts.
Supporting Automation Performance
In automated warehouses, robots and conveyors follow predefined routes. Heat mapping helps monitor how these systems interact with human workers and with each other.
If certain aisles consistently show high robot traffic, planners may reroute flows or adjust scheduling. This prevents slowdowns and reduces the risk of operational conflicts.
Data Sources Behind Digital Mapping
Warehouse heat mapping tools depend on accurate, continuous data collection. Common data inputs include:
- Location tracking systems: Ultra-wideband (UWB), Wi-Fi triangulation, or RFID
- Inventory movement data: Pick, put-away, and replenishment scans
- Equipment telemetry: Forklift usage, conveyor speeds, robot paths
- Environmental sensors: Temperature, humidity, and safety alerts in sensitive zones
By combining operational and environmental data, facilities can also detect patterns that affect both performance and compliance.
Benefits Beyond Capacity Optimization
While capacity planning is a primary goal, warehouse heat mapping also supports broader operational improvements.
Safety and Risk Reduction
Heat maps can reveal high-traffic intersections where accidents are more likely. Managers can then:
- Adjust pedestrian and vehicle routes
- Add signage or barriers
- Change shift timing to reduce overlap
These proactive steps help lower incident rates and improve workplace safety.
Layout and Expansion Planning
When planning a layout redesign or facility expansion, historical heat mapping data provides evidence for decision-making. Instead of relying solely on estimates, planners can see exactly where growth pressure exists.
This leads to more accurate capital planning and better long-term use of space.
Technology Trends Driving Adoption
Several technology trends are accelerating the use of heat mapping in logistics:
- Growth in IoT device deployment across warehouses
- Wider adoption of real-time location systems (RTLS)
- Integration between WMS, WES (Warehouse Execution Systems), and analytics platforms
- Increased focus on data-driven operational optimization
Industry analysts note that digital twin technology is also emerging. In these systems, heat mapping data feeds into virtual warehouse models that simulate changes before they are implemented physically.
Challenges and Considerations
Despite its advantages, warehouse heat mapping requires careful implementation.
Data Accuracy and Integration
Inaccurate or incomplete data can lead to misleading visualizations. Systems must integrate cleanly with existing platforms and maintain consistent data quality.
Privacy and Workforce Transparency
When tracking worker movement, companies must consider privacy regulations and communicate clearly about how data is used. Transparency helps maintain trust and compliance.
Scalability
As operations grow, mapping systems must handle larger data volumes without performance issues. Cloud-based analytics platforms are increasingly used to address this need.
Key Takeaways
Warehouse heat mapping tools are transforming how logistics facilities understand and manage space. By visualizing real-time activity, these systems help identify congestion, improve layout decisions, and support safer, more efficient operations. As data integration improves, heat mapping is expected to play an even larger role in warehouse analytics strategies.
FAQs
Warehouse heat mapping is used to visualize activity levels across different warehouse zones. It helps managers identify congestion, underused areas, and operational bottlenecks. This insight supports better space utilization, improved workflow design, and more accurate capacity planning in both manual and automated facilities.
Warehouse heat mapping tools gather data from systems such as WMS platforms, IoT sensors, RFID tags, and equipment telemetry. These data sources track movement, inventory activity, and equipment usage. The information is then layered onto a digital warehouse layout to create visual activity maps.
Yes. Heat maps reveal high-traffic zones and frequent crossing points between workers and vehicles. Managers can use this information to redesign routes, adjust schedules, and introduce safety controls. These actions help reduce accident risks and improve overall workplace safety.
No. While large distribution centers benefit significantly, smaller warehouses can also use heat mapping. Even modest operations gain value from understanding space utilization and traffic flow. Scalable software solutions allow facilities of various sizes to adopt this technology.
In automated environments, heat mapping tracks robot routes, conveyor usage, and interaction points between machines and workers. This visibility helps operators optimize system performance, prevent congestion, and adjust workflows to maintain consistent throughput and efficiency.